


Owning a single-family rental property can be a lucrative investment, but it’s not a guaranteed money maker, especially in some markets.
In fact, some locations may leave you struggling to break even or worse. To help you navigate the world of single-family rentals and maximize your cash flow, we’ve compiled a comprehensive list of the 101 best cash flow rental markets, focusing on single-family rentals.
Our research looked into 312 U.S. metros. We analyzed critical factors that can make the biggest impact on your ROI. This data-driven approach ensures that our list is the ultimate resource for identifying the most promising markets for single-family rental investments.
Get your best investor financing.What’s in this article?
Why is cash-flowing a single-family rental so hard?
Achieving positive cash flow with a single-family rental can be challenging due to several factors:
- One renter covering the mortgage: Unlike multi-family properties or apartment buildings, you rely on a single renter to cover the mortgage payment plus all other costs, which may not always be enough.
- Higher risk of vacancy: With only one renter, the risk of vacancy is higher. If your tenant moves out, you’ll need to find a new one quickly to avoid losing income.
- Higher per-unit property taxes and insurance: Single-family homes typically have higher per-unit property taxes and insurance costs compared to multi-family properties or apartment buildings. These expenses eat into your cash flow.
- Home prices outpacing rents: In many markets, home prices have increased faster than rental rates. This makes mortgage payments higher than potential rents.
- Maintenance and repair costs: As the landlord, the responsibility for maintaining the property and handling any necessary repairs can be heavy. These expenses can be unpredictable and add strain to your cash flow.
- Tenant management: Managing a single-family rental requires time and effort to screen tenants, collect rent, and address any issues that arise. This can be challenging, especially if you own multiple properties spread across a region.

Why do so many people invest in single-family then?
Despite the challenges, single-family rentals remain a popular investment choice for several reasons:
- Most sought-after asset: Single-family homes are highly desirable, and there’s usually strong demand if you need to sell. Multi-family properties and apartment buildings can be harder to sell due to a smaller pool of interested buyers.
- Familiarity: Most people have lived in a single-family home or know someone who does, making it a familiar and comfortable investment option.
- Wide selection: There is an abundance of single-family homes available in almost every market, offering investors plenty of choices when searching for the right property.
- Easier financing: Obtaining financing for a single-family rental is often simpler than securing funds for multi-family properties or apartment buildings. Lenders tend to view single-family homes as lower-risk investments.
- Appreciation potential: Single-family homes typically experience higher appreciation rates compared to multi-family properties, which can result in increased equity and long-term wealth-building opportunities.
- Lower tenant turnover: Yes, your rental income is dependent on one tenant—but tenants in single-family homes often stay longer than those in multi-family properties, reducing the frequency and costs associated with finding new renters.

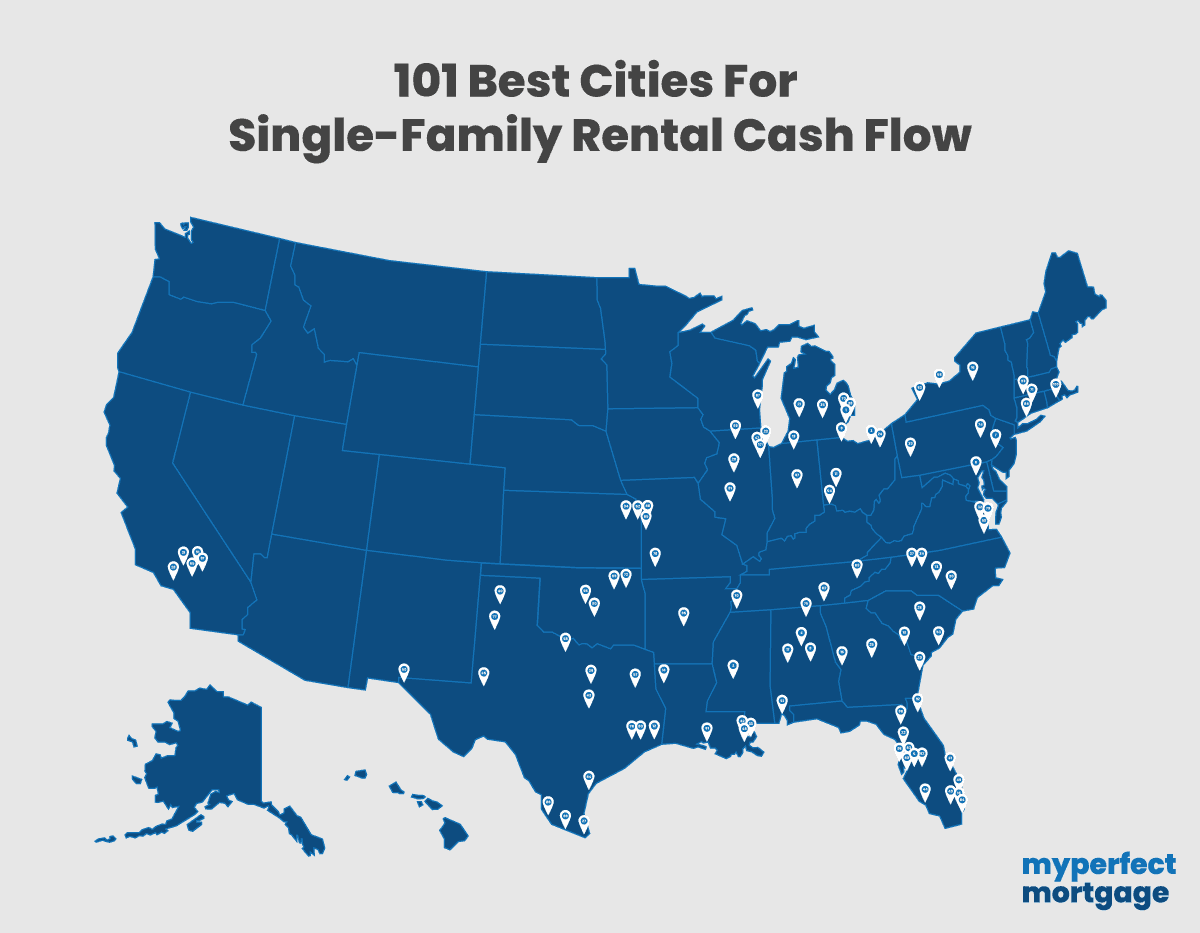
The 101 best cash flow rental markets for single-family homes
We factored in typical home prices, rents, estimated property taxes and homeowners insurance, vacancy factors, and more. This list is the best ever created if you want to know which markets have the highest potential to yield single-family rental cash flow.
You’ll also note that some of our best cash-flow markets have negative cash flow! This is expected, since single-family residences are some of the hardest properties to find cash flow, especially as interest rates, prices, and property taxes rise. You have your work cut out for you as a single-family investor!
| Rank | City | Cash Flow | Price | Rent | Tax | Vacancy |
| 1 | Detroit, MI | $722 | $69,512 | $1,201 | $83 | 6.6% |
| 2 | Jackson, MS | $690 | $69,309 | $1,159 | $54 | 8.0% |
| 3 | Cleveland, OH | $645 | $97,805 | $1,273 | $123 | 4.9% |
| 4 | Birmingham, AL | $609 | $96,094 | $1,211 | $44 | 9.3% |
| 5 | Lehigh Acres, FL | $580 | $256,956 | $2,034 | $169 | 7.6% |
| 6 | Baltimore, MD | $578 | $172,111 | $1,612 | $205 | 4.2% |
| 7 | Philadelphia, PA | $475 | $209,847 | $1,664 | $163 | 5.3% |
| 8 | Montgomery, AL | $380 | $133,237 | $1,153 | $39 | 9.3% |
| 9 | Toledo, OH | $375 | $100,945 | $1,057 | $152 | 4.9% |
| 10 | Memphis, TN | $375 | $144,060 | $1,293 | $154 | 7.8% |
| 11 | Dayton, OH | $347 | $102,423 | $1,048 | $163 | 4.9% |
| 12 | Beaumont, TX | $342 | $146,934 | $1,331 | $207 | 8.1% |
| 13 | South Bend, IN | $322 | $153,346 | $1,260 | $115 | 8.8% |
| 14 | Shreveport, LA | $314 | $126,342 | $1,076 | $79 | 7.8% |
| 15 | Columbus, GA | $297 | $143,245 | $1,151 | $105 | 6.7% |
| 16 | Syracuse, NY | $296 | $157,435 | $1,351 | $279 | 4.3% |
| 17 | Tuscaloosa, AL | $288 | $203,085 | $1,421 | $68 | 9.3% |
| 18 | Miami Gardens, FL | $286 | $401,674 | $2,546 | $298 | 7.6% |
| 19 | Augusta, GA | $283 | $167,962 | $1,280 | $134 | 6.7% |
| 20 | Peoria, IL | $282 | $107,538 | $1,107 | $232 | 7.7% |
| 21 | Grand Rapids, MI | $276 | $237,792 | $1,695 | $238 | 6.6% |
| 22 | Spring Hill, FL | $264 | $302,692 | $1,978 | $212 | 7.6% |
| 23 | Chicago, IL | $259 | $279,053 | $1,975 | $323 | 7.7% |
| 24 | Akron, OH | $255 | $106,310 | $978 | $164 | 4.9% |
| 25 | Macon, GA | $232 | $141,432 | $1,123 | $150 | 6.7% |
| 26 | Columbia, SC | $229 | $214,614 | $1,393 | $122 | 4.2% |
| 27 | Brownsville, TX | $227 | $161,832 | $1,330 | $251 | 8.1% |
| 28 | Lancaster, CA | $217 | $434,680 | $2,600 | $366 | 4.1% |
| 29 | Savannah, GA | $200 | $267,396 | $1,745 | $223 | 6.7% |
| 30 | Fayetteville, NC | $197 | $182,263 | $1,339 | $190 | 8.3% |
| 31 | Palmdale, CA | $179 | $466,660 | $2,738 | $397 | 4.1% |
| 32 | Hampton, VA | $167 | $239,835 | $1,500 | $192 | 3.3% |
| 33 | New Orleans, LA | $166 | $253,914 | $1,616 | $169 | 7.8% |
| 34 | High Point, NC | $151 | $214,030 | $1,458 | $205 | 8.3% |
| 35 | Lansing, MI | $148 | $129,715 | $1,065 | $231 | 6.6% |
| 36 | Mesquite, TX | $148 | $264,998 | $1,827 | $342 | 8.1% |
| 37 | Winston-Salem, NC | $145 | $227,224 | $1,508 | $199 | 8.3% |
| 38 | Warren, MI | $142 | $187,616 | $1,345 | $250 | 6.6% |
| 39 | Pittsburgh, PA | $142 | $212,105 | $1,403 | $214 | 5.3% |
| 40 | Amarillo, TX | $138 | $186,386 | $1,359 | $253 | 8.1% |
| 41 | Palm Bay, FL | $137 | $304,142 | $1,874 | $226 | 7.6% |
| 42 | Baton Rouge, LA | $133 | $211,333 | $1,299 | $83 | 7.8% |
| 43 | Waco, TX | $133 | $210,805 | $1,539 | $323 | 8.1% |
| 44 | Cape Coral, FL | $132 | $388,030 | $2,356 | $323 | 7.6% |
| 45 | Odessa, TX | $126 | $197,896 | $1,360 | $211 | 8.1% |
| 46 | Pompano Beach, FL | $95 | $404,427 | $2,393 | $320 | 7.6% |
| 47 | Aurora, IL | $93 | $258,287 | $1,928 | $540 | 7.7% |
| 48 | Metairie, LA | $93 | $299,705 | $1,731 | $142 | 7.8% |
| 49 | Hialeah, FL | $92 | $480,171 | $2,693 | $268 | 7.6% |
| 50 | El Paso, TX | $88 | $198,881 | $1,468 | $353 | 8.1% |
| 51 | Mobile, AL | $87 | $176,163 | $1,093 | $69 | 9.3% |
| 52 | Kansas City, KS | $81 | $166,056 | $1,158 | $217 | 6.9% |
| 53 | North Charleston, SC | $75 | $278,868 | $1,557 | $144 | 4.2% |
| 54 | Cincinnati, OH | $68 | $214,209 | $1,396 | $277 | 4.9% |
| 55 | Oklahoma City, OK | $67 | $189,568 | $1,216 | $152 | 9.0% |
| 56 | Rochester, NY | $63 | $182,798 | $1,304 | $343 | 4.3% |
| 57 | Tyler, TX | $62 | $231,318 | $1,493 | $251 | 8.1% |
| 58 | Wichita Falls, TX | $57 | $150,546 | $1,102 | $243 | 8.1% |
| 59 | Norfolk, VA | $57 | $265,082 | $1,539 | $223 | 3.3% |
| 60 | Brandon, FL | $51 | $352,455 | $2,059 | $270 | 7.6% |
| 61 | Lafayette, LA | $48 | $204,436 | $1,204 | $104 | 7.8% |
| 62 | Lakeland, FL | $44 | $285,445 | $1,674 | $205 | 7.6% |
| 63 | Buffalo, NY | $40 | $201,123 | $1,222 | $193 | 4.3% |
| 64 | Corpus Christi, TX | $37 | $206,405 | $1,376 | $275 | 8.1% |
| 65 | Rialto, CA | $30 | $519,781 | $2,786 | $295 | 4.1% |
| 66 | McAllen, TX | $18 | $204,904 | $1,394 | $319 | 8.1% |
| 67 | Indianapolis, IN | $17 | $216,310 | $1,304 | $166 | 8.8% |
| 68 | Independence, MO | $14 | $182,202 | $1,169 | $185 | 9.6% |
| 69 | Tulsa, OK | $9 | $187,844 | $1,166 | $167 | 9.0% |
| 70 | Sterling Heights, MI | $8 | $275,229 | $1,672 | $305 | 6.6% |
| 71 | Hartford, CT | -$4 | $217,604 | $1,396 | $377 | 2.0% |
| 72 | Broken Arrow, OK | -$4 | $253,050 | $1,530 | $236 | 9.0% |
| 73 | Greensboro, NC | -$5 | $234,901 | $1,422 | $225 | 8.3% |
| 74 | Allentown, PA | -$9 | $247,610 | $1,609 | $411 | 5.3% |
| 75 | Huntsville, AL | -$20 | $266,255 | $1,457 | $111 | 9.3% |
| 76 | Houston, TX | -$22 | $261,190 | $1,621 | $322 | 8.1% |
| 77 | Lubbock, TX | -$28 | $200,686 | $1,307 | $298 | 8.1% |
| 78 | Springfield, MO | -$28 | $210,727 | $1,225 | $148 | 9.6% |
| 79 | Newport News, VA | -$29 | $254,902 | $1,416 | $227 | 3.3% |
| 80 | Pasadena, TX | -$30 | $209,745 | $1,357 | $308 | 8.1% |
| 81 | Springfield, IL | -$32 | $137,867 | $945 | $238 | 7.7% |
| 82 | Chattanooga, TN | -$37 | $264,744 | $1,513 | $216 | 7.8% |
| 83 | Tampa, FL | -$40 | $386,523 | $2,147 | $290 | 7.6% |
| 84 | Miami, FL | -$44 | $579,573 | $3,202 | $401 | 7.6% |
| 85 | Kansas City, MO | -$53 | $216,737 | $1,293 | $211 | 9.6% |
| 86 | New Haven, CT | -$56 | $277,340 | $1,809 | $592 | 2.0% |
| 87 | Milwaukee, WI | -$57 | $174,866 | $1,131 | $316 | 4.5% |
| 88 | Laredo, TX | -$58 | $197,976 | $1,284 | $317 | 8.1% |
| 89 | Knoxville, TN | -$59 | $307,789 | $1,692 | $215 | 7.8% |
| 90 | Norman, OK | -$62 | $235,420 | $1,345 | $192 | 9.0% |
| 91 | Victorville, CA | -$67 | $400,436 | $2,134 | $320 | 4.1% |
| 92 | Jacksonville, FL | -$68 | $300,609 | $1,658 | $228 | 7.6% |
| 93 | Springfield, MA | -$69 | $249,650 | $1,489 | $374 | 3.0% |
| 94 | Topeka, KS | -$75 | $163,811 | $983 | $205 | 6.9% |
| 95 | Little Rock, AR | -$79 | $189,403 | $1,109 | $144 | 12.9% |
| 96 | Clearwater, FL | -$88 | $377,151 | $2,034 | $267 | 7.6% |
| 97 | San Bernardino, CA | -$89 | $444,074 | $2,263 | $270 | 4.1% |
| 98 | Gainesville, FL | -$92 | $295,957 | $1,631 | $247 | 7.6% |
| 99 | Rockford, IL | -$97 | $129,333 | $891 | $288 | 7.7% |
| 100 | Providence, RI | -$98 | $341,734 | $1,963 | $419 | 5.5% |
| 101 | Joliet, IL | -$106 | $208,141 | $1,364 | $404 | 7.7% |
Highlighting the 10 best single-family rental cash-flow cities

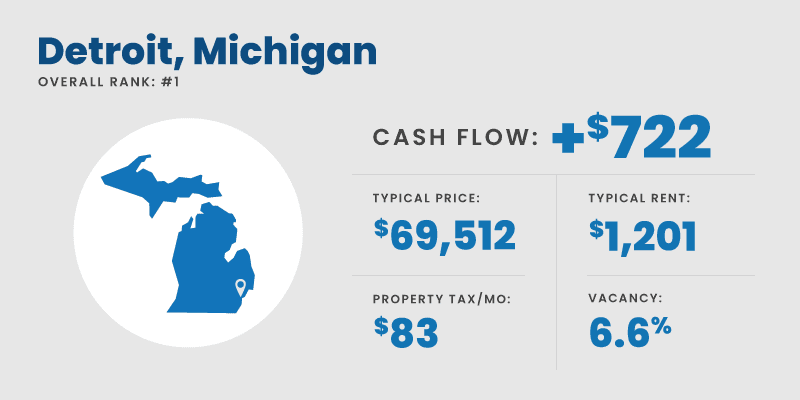
1. Detroit, Michigan
- Cash flow: +$722
- Typical price: $69,512
- Typical rent: $1,201
- Property tax/mo: $83
- Vacancy: 6.6%
The Detroit single-family rental market presents unique opportunities for investors due to its ongoing revitalization and affordable housing options. The median home price in Detroit sits just below $70,000, making it an attractive option for those looking to enter the real estate investment market. The city has experienced an influx of new residents and businesses, leading to increased rental demand and a decrease in vacancy rates.
As detailed in Roofstock’s blog, Detroit is undergoing significant economic development with investments in infrastructure, education, and job creation. These improvements are expected to drive further growth in the rental market. Zillow’s rental manager market trends also show that rent in Detroit has been steadily increasing over the past year.

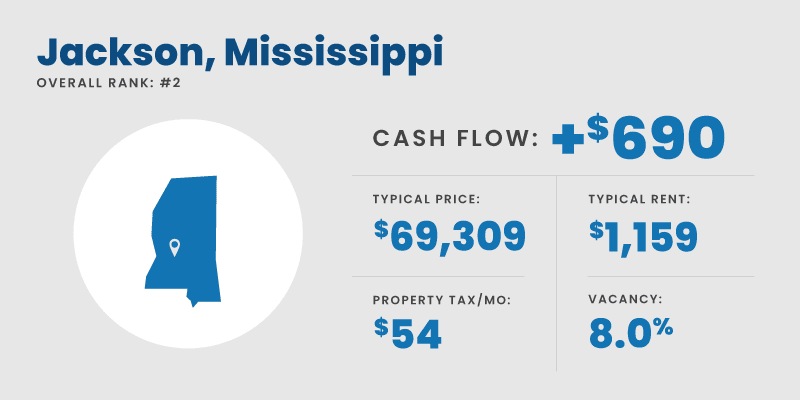
2. Jackson, Mississippi
- Cash flow: +$690
- Typical price: $69,309
- Typical rent: $1,159
- Property tax/mo: $54
- Vacancy: 8.0%
The Jackson, Mississippi single-family rental market offers promising opportunities for investors, thanks to its affordable housing options and stable rental demand.
As reported by Roofstock, Jackson’s real estate market is characterized by low home prices and high rental yields, making it an ideal location for cash-flow-focused investors. The city boasts a diverse economy with growing industries such as healthcare, manufacturing, and technology, which contribute to a steady job market and rental demand.
Jackson provides a relatively low barrier of entry for potential investors. The city is also experiencing a revitalization of its downtown area, which can have a positive impact on property values and rental demand in surrounding neighborhoods.
Qualify for a rental property in your market.
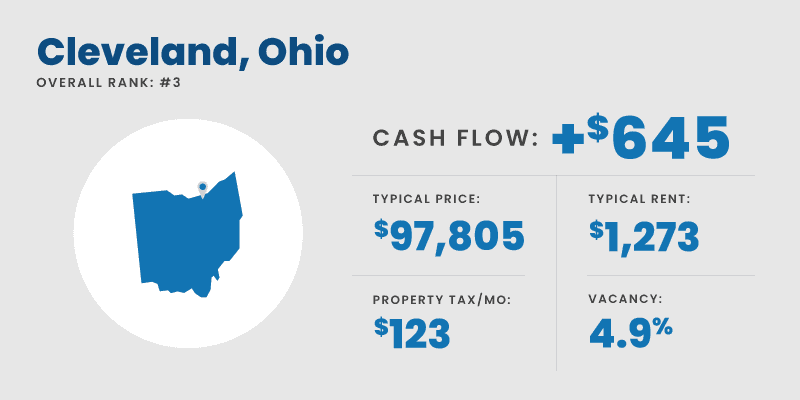
3. Cleveland, Ohio
- Cash flow: +$645
- Typical price: $97,805
- Typical rent: $1,273
- Property tax/mo: $123
- Vacancy: 4.9%
Cleveland, Ohio comes in at number three on our list due to its affordable housing and steady rental demand. According to Roofstock, Cleveland’s real estate market is characterized by low home prices and high gross rental yields, making it an appealing option for cash-flow-focused investors.
The city boasts a diverse economy, with growing industries such as healthcare, advanced manufacturing, and technology, which contribute to a stable job market and consistent rental demand.

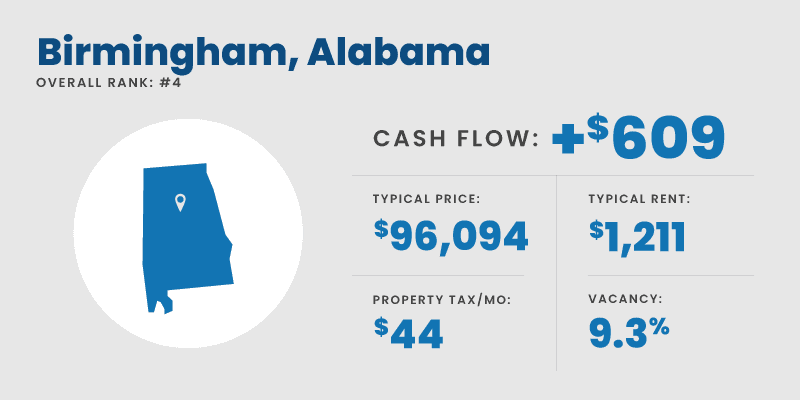
4. Birmingham, Alabama
- Cash flow: +$609
- Typical price: $96,094
- Typical rent: $1,211
- Property tax/mo: $44
- Vacancy: 9.3%
The beautiful city of Birmingham’s real estate market is characterized by low home prices, high gross rental yields, and a diverse economy that contributes to a steady job market. Its growing industries include such diverse industries as healthcare, manufacturing, and technology, which help maintain consistent rental demand.
As of last month, Birmingham, AL offered a selection of 1,283 homes for sale—the number of homes for sale increased by 24.4% compared to March 2023. Properties in this real estate market were listed for an average of 28 days in the same period, with a median list price of $291,333.
Over 86 listings in Birmingham, AL sold above the asking price during this period, while more than 54 sold at the asking price and over 111 sold below the asking price.

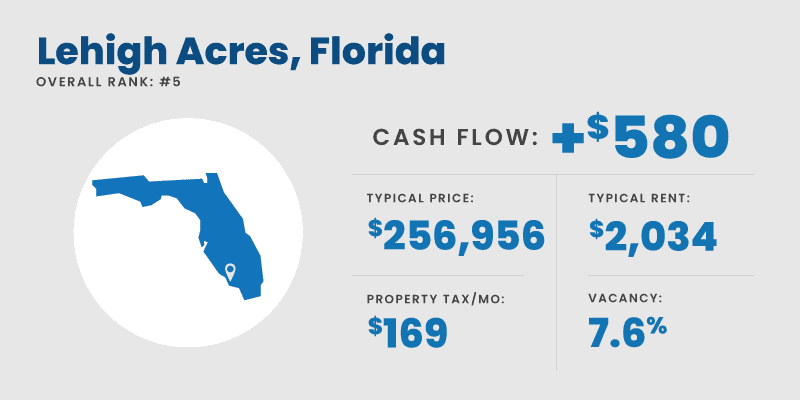
5. Lehigh Acres, Florida
- Cash flow: +$580
- Typical price: $256,956
- Typical rent: $2,034
- Property tax/mo: $169
- Vacancy: 7.6%
Based on Redfin’s housing market data, the area is currently experiencing a competitive housing market with properties typically receiving multiple offers, often selling above list price, and going pending in around 19 days.
In the Lehigh Acres, FL real estate market, there are currently 1,572 homes for sale. From March 2023 to April 2023, the number of listings experienced a 7.4% decrease. The average listing age in April 2023 was 44 days. Over 66 listings in Lehigh Acres, FL sold above the asking price during this period, while more than 93 sold at the asking price and over 153 sold below the asking price.

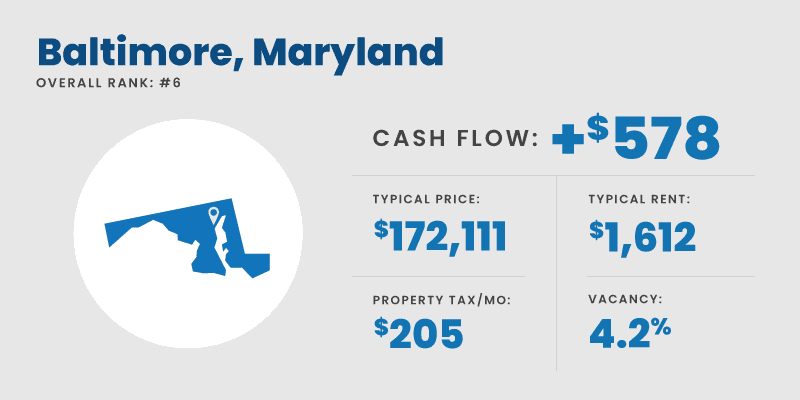
6. Baltimore, Maryland
- Cash flow: +$578
- Typical price: $172,111
- Typical rent: $1,612
- Property tax/mo: $205
- Vacancy: 4.2%
High property prices and low-interest rates have encouraged many investors to become long-term rental property owners here. Lower monthly payments due to reduced interest rates, combined with increasing rents, can boost cash flow for rental property investors.
However, it’s important to note that the Baltimore real estate market has a relatively high foreclosure rate. This higher-than-average number of distressed homeowners presents an opportunity for investors to consider rehabbing foreclosures as an additional exit strategy.

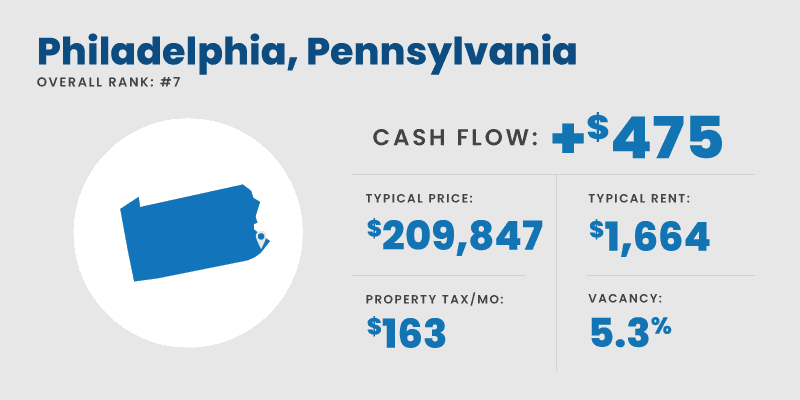
7. Philadelphia, Pennsylvania
- Cash flow: +$475
- Typical price: $209,847
- Typical rent: $1,664
- Property tax/mo: $163
- Vacancy: 5.3%
Home price appreciation in the Philadelphia metro area outpaces many other regions, with buyers facing limited options and fast-selling properties. The housing market is expected to be more restrained compared to the past two years, due to low inventory and higher mortgage rates.
In the spring housing market, local markets will vary, with some counties experiencing stronger demand and price growth while others see slower activity. The housing market is likely to stabilize and gain momentum in the second half of 2023.

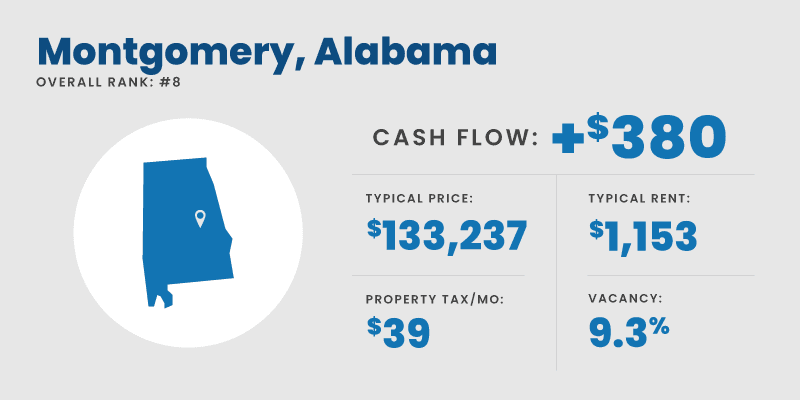
8. Montgomery, Alabama
- Cash flow: +$380
- Typical price: $133,237
- Typical rent: $1,153
- Property tax/mo: $39
- Vacancy: 9.3%
As our second ‘Bama city on this list, the Montgomery real estate market has significantly improved since the recession, with increasing equity and more active homeowners.
Consequently, Montgomery real estate investing has also witnessed similar positive trends. In 2022, the Montgomery, Alabama real estate market is thriving, driven by strong rental housing demand, which is not solely due to the presence of eight or more colleges and universities.
The city’s cost of living is below the U.S. average, and there are several well-paying jobs in the area. Montgomery’s job market grew by 1.1% last year, with a predicted 30.3% growth over the next decade.

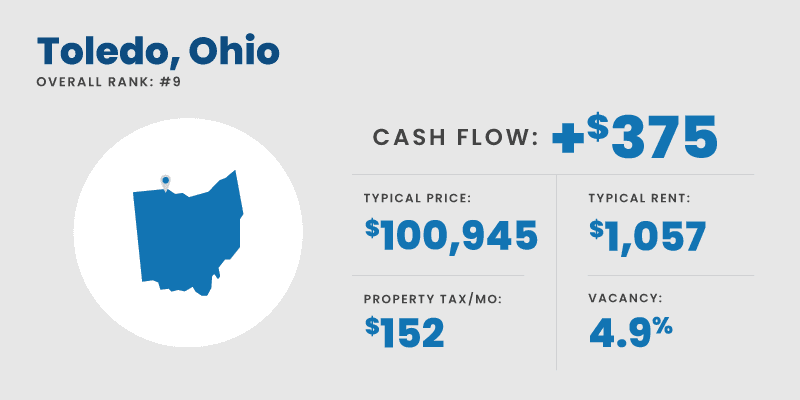
9. Toledo, Ohio
- Cash flow: +$375
- Typical price: $100,945
- Typical rent: $1,057
- Property tax/mo: $152
- Vacancy: 4.9%
Toledo, home to around 271,000 residents, is the 4th most populated city in Ohio and the 79th-largest in the U.S. The Toledo metropolitan area comprises nearly 644,000 people and includes Fulton, Wood, and Lucas counties. Located just 40 miles south of Detroit, Toledo is part of the Great Lakes Megalopolis and has strong economic ties to its northern neighbor.
Toledo ranks #1 for new business investment, indicating growing economic momentum. Currently, $2.2 billion worth of development projects are underway, expected to create 3,500 new jobs and over 1,000 new residential housing units.

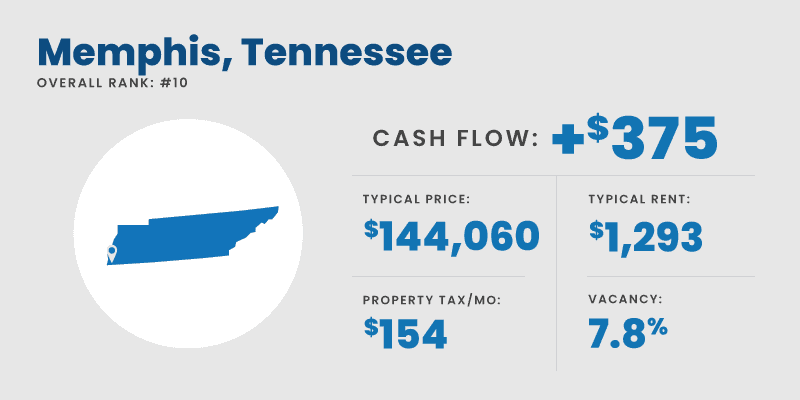
10. Memphis, Tennessee
- Cash flow: +$375
- Typical price: $144,060
- Typical rent: $1,293
- Property tax/mo: $154
- Vacancy: 7.8%
Memphis, Tennessee, a city rich in history, culture, and music, also boasts a thriving real estate market. The Memphis Area Association of REALTORS® (MAAR) reported a significant drop in total sales in April 2023 compared to April 2022.
Total sales, combining existing and new home sales, decreased by 36.6%, with 1,018 units sold compared to 1,605 in April 2022. Year-to-date total sales also declined by 28.6%, with 4,368 units sold compared to 6,121 during the same period last year.
Despite the reduction in total sales, the median sales price for homes in Memphis slightly increased by 0.2% to $216,000 in April 2023 compared to $215,500 in April 2022.
Get your best investor financing.
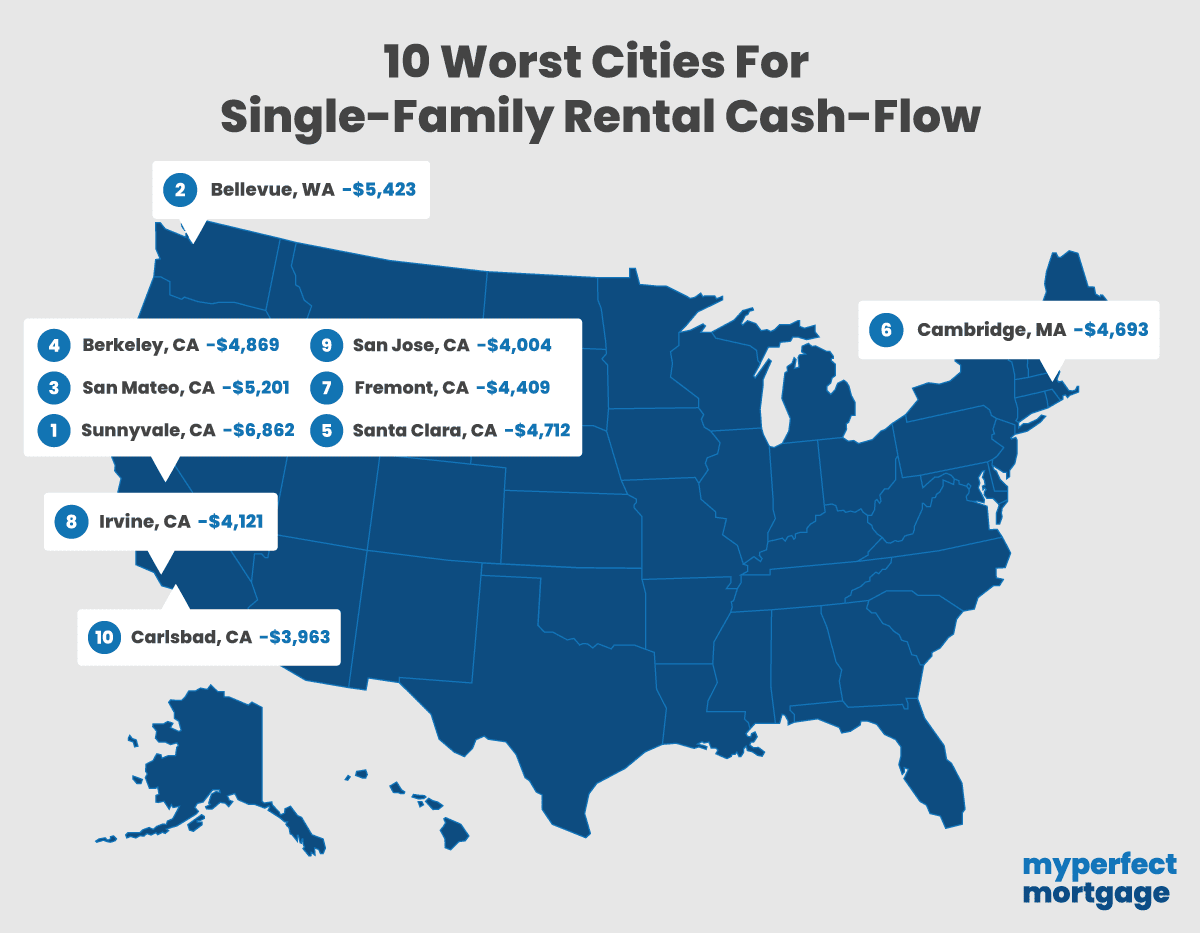
10 worst cities for cash flow
With every list of the best options, there’s going to be a bottom to that list. In this section, we’ll unveil the “10 worst cities for cash flow,” highlighting locations that may pose challenges for investors seeking consistent returns on their rental properties.
Of the 312 metros analyzed, these are the worst of the worst for single-family rental cash flow.
| Overall Rank | Worst Cash Flow Rank | City | Cash Flow | Price | Rent | Tax/mo | Vacancy |
|---|---|---|---|---|---|---|---|
| 303 | 10 | Carlsbad, CA | -$3,963 | $1,376,003 | $3,395 | $ 871 | 4.1% |
| 304 | 9 | San Jose, CA | -$4,004 | $1,317,534 | $3,016 | $ 791 | 4.1% |
| 305 | 8 | Irvine, CA | -$4,121 | $1,354,599 | $3,147 | $ 869 | 4.1% |
| 306 | 7 | Fremont, CA | -$4,409 | $1,384,143 | $2,937 | $ 796 | 4.1% |
| 307 | 6 | Cambridge, MA | -$4,693 | $1,555,411 | $3,139 | $ 518 | 3.0% |
| 308 | 5 | Santa Clara, CA | -$4,712 | $1,511,655 | $3,221 | $ 794 | 4.1% |
| 309 | 4 | Berkeley, CA | -$4,869 | $1,437,178 | $2,825 | $ 886 | 4.1% |
| 310 | 3 | San Mateo, CA | -$5,201 | $1,625,278 | $3,311 | $ 840 | 4.1% |
| 311 | 2 | Bellevue, WA | -$5,423 | $1,493,614 | $2,613 | $ 909 | 5.5% |
| 312 | 1 | Sunnyvale, CA | -$6,862 | $1,936,206 | $3,179 | $ 887 | 4.1% |
Here’s a breakdown of what makes three of these cities tick (or not tick, as the case may be):
San Mateo, CA
California, unfortunately, contains most of the cities at the bottom of the list. San Mateo, for example, boasts numerous picturesque parks and outdoor areas to discover. Coyote Point Recreation Area and Central Park provide breathtaking bay views, beaches, and outdoor recreation, making it a desirable area.
However, investors may have less luck here. The market also features a typical house price of $1.6M and a rental average of only $3,311, making the cash flow a terrible -$5,201. Not good.
Cambridge, MA
One of the few non-CA cities on the bottom of our list—Cambridge is situated within Massachusetts’ Greater Boston area, and is renowned for housing two prestigious universities, Harvard and MIT, both located within a two-mile radius.
As of April of this year, there were only 242 homes listed for sale here—a low inventory to choose from—and the average time on the market was 35 days, with a typical list price of $1,550,411.
The average cash flow here is slightly better than San Mateo, but you could still lose your shirt at negative cash flow of -$4,693.
Sunnyvale, CA
At the very bottom of the list is Sunnyvale, CA. Don’t get us wrong, Sunnyvale is a beautiful place. Nestled in the core of Silicon Valley, it presents a vibrant city that combines innovation, scenic beauty, and a wide range of culinary delights.
But our calculations also show a cash flow in the red to the tune of $6,862. So… yeah.
National Coverage Of This Study:
BestStocks.com: Exploring the Rise of Single-Family Rental Cash Flow
DS News: Examining the Best U.S. Cities for Single-Family Rental Cash Flow
More standout cities to consider
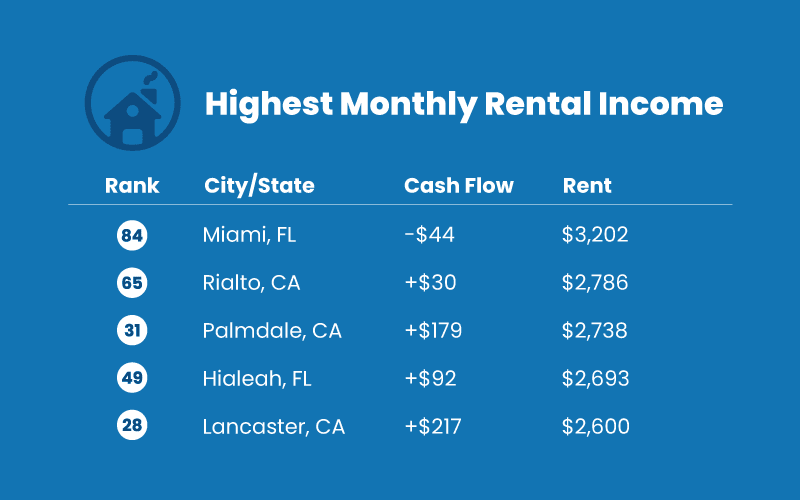
Highest base rent: Interest in high rents, despite other costs? These cities are for you.

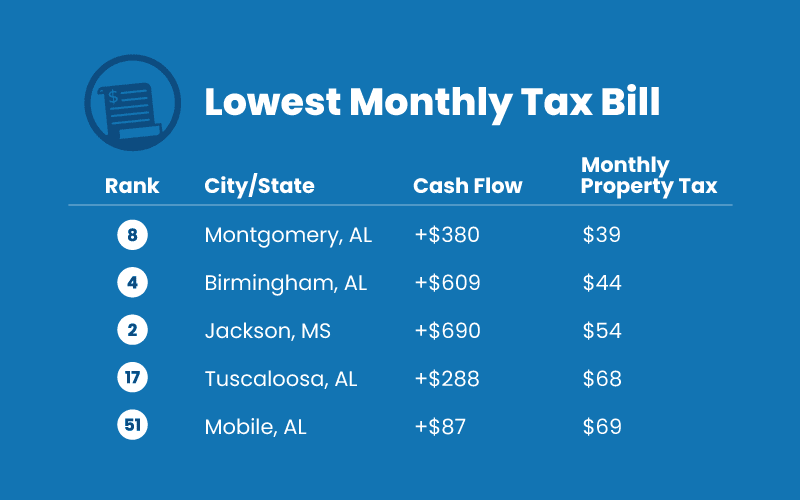
Lowest taxes: Let’s be honest. No one likes taxes. If you like the idea of a small property tax bill, look into these cities.

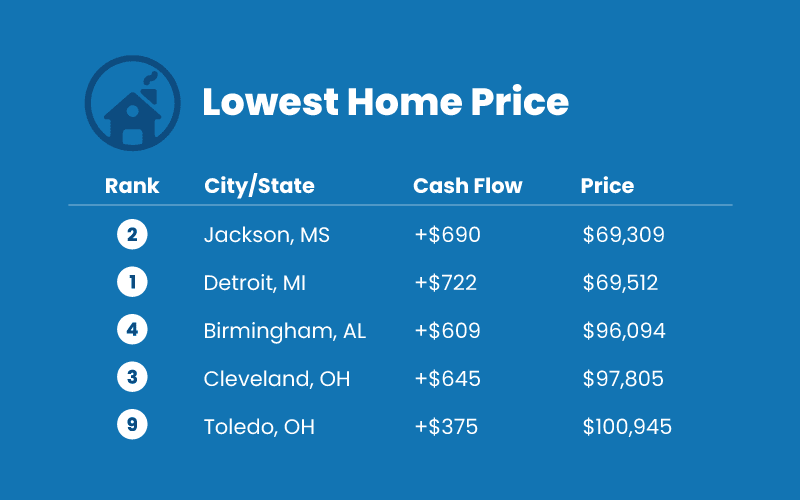
Cheap homes: A low purchase price means a very small mortgage payment or none at all. This could result in huge cash flow.

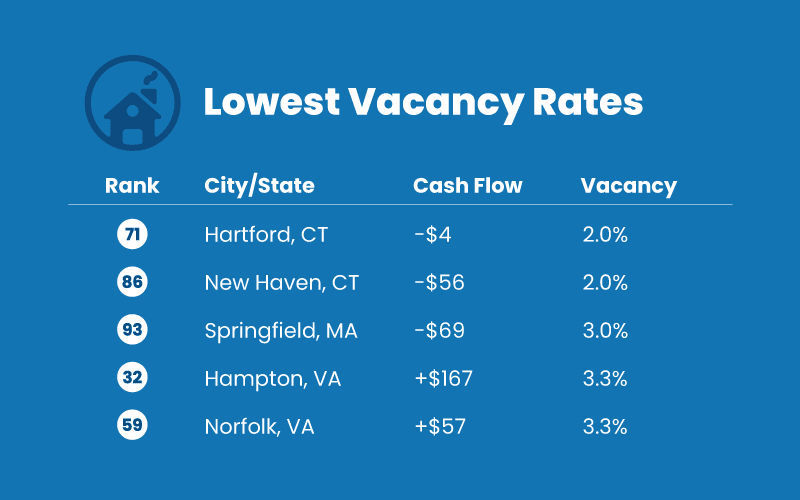
Keeping your rental occupied: Don’t like vacancy? These markets have some of the highest occupancy rates in the nation.

Is it automatically “good” to invest in high-cash-flow areas and “bad” in low-cash-flow areas?
Despite our recommendations, investing in high-cash-flow areas isn’t always a favorable decision, nor is it necessarily a poor choice to invest in low-cash-flow areas.
There are numerous cities with high cash flow where you might hesitate to own a home due to factors such as a declining economy, aging housing stock, shrinking population, and diminishing industries.
Our list solely focuses on the numbers, leaving it up to you to investigate the specific market and determine if it’s worth considering.
On the other hand, there are cities with low cash flow that may still present attractive investment opportunities due to significant economic potential in the area.
Cash flow is just one aspect of investing, and other factors like property appreciation, job growth, and local infrastructure development should also be taken into account when making investment decisions.
Conduct thorough research and analyze the overall market conditions before deciding whether a particular location is right for your investment portfolio.
Qualify for your rental property mortgage.How to find cash-flowing properties in high-cost areas
While some investors may have the opportunity to invest in top cash-flow cities like Detroit, Jackson (Mississippi), or Cleveland, not everyone has that luxury. So, how can you find profitable single-family residences in expensive markets if that’s where your investment needs lie?
- Explore up-and-coming neighborhoods: Keep an eye out for emerging areas within high-cost cities, as these neighborhoods often offer more affordable properties with potential for growth and cash flow.
- Consider fixer-uppers: Properties in need of renovation can be purchased at a lower price, and with strategic improvements, they can generate higher rents and appreciation. Hard money loans and fix and flip loans are tailor-made for these kinds of investments.
- Look for motivated sellers: Finding property owners who are eager to sell, whether due to financial constraints or other reasons, can lead to better deals and potentially higher cash flow.
- Leverage short-term rental platforms: In high-cost areas, utilizing platforms like Airbnb or VRBO can help maximize rental income by capitalizing on tourist demand and higher nightly rates.
- Utilize professional property management: Employing a property manager can help optimize your cash flow by ensuring that your property is well-maintained, vacancies are minimized, you avoid deadbeat tenants, and rents are collected efficiently.
- Network with local real estate professionals: Establish relationships with local real estate agents, brokers, and investor groups, as they can provide valuable insights and leads on cash-flowing properties in high-cost areas.
Remember, finding cash-flowing properties in expensive markets requires patience, research, and a strategic approach.
Is it worth buying a single-family rental even if you lose money each month?
Purchasing a single-family rental property that loses money each month may seem counterintuitive, but some investors adopt this strategy for various reasons.
- Anticipating rent increases: Investors might believe that rents will continue to rise while their mortgage payments, taxes, and insurance remain relatively stable. In this scenario, the property could eventually generate positive cash flow.
- Pros: Potential for future cash flow; potential appreciation.
- Cons: Risk of rents not increasing as expected.
- Offsetting profits for tax purposes: Full-time investors might use a negatively cash-flowing property to offset profits from other properties, reducing their overall tax liability.
- Pros: Tax advantages; potential appreciation.
- Cons: Reliance on other profitable properties.
- Banking on property appreciation: Investors who focus on long-term property appreciation might be willing to endure monthly losses in exchange for the anticipated increase in property value.
- Pros: Potential for significant appreciation; potential tax benefits from deducting losses.
- Cons: Market fluctuations may impact property value.
Before deciding to invest in a negatively cash-flowing single-family rental, it’s crucial to carefully consider your risk tolerance, investment goals, and financial situation and be prepared for the consequences of ongoing negative cash flow.
Best cash flow rental markets
Real estate investing is a multifaceted endeavor that requires thorough research, strategic planning, and a keen understanding of market trends.
Whether you’re seeking high cash-flow properties or considering negatively cash-flowing investments, it’s crucial to weigh the potential benefits and risks associated with each approach.
By staying informed, networking with professionals, and aligning your investment strategy with your financial goals, you can maximize your chances of success in the dynamic world of real estate.
Get your best investor financing.Methodology
We used publicly available data on 312 cities to calculate cash flow as follows.
([Rent X 110%] X [vacancy rate -1]) – (Mortgage payment + taxes + insurance)
For example, Tulsa, Oklahoma’s numbers are:
([$1,166 X 110%] X [0.09 – 1]) = $1167 – ($890 + $167 + $100) = $9 cash flow/mo
More information on each data point is below.
Data sources:
Single-family home prices: We used the Zillow Home Value Index Single-Family Homes Time Series for the typical home value for the region.
Payment: We assumed a 25% down payment at 6.5% on a 30-year mortgage
Single-family rents: Zillow Observed Rent Index: All Homes Plus Multifamily Time Series. We grossed up this data by 10% to account for higher rent prices commanded for single-family homes compared to single-family plus all other home types (apartments, duplexes, etc.), as Zillow does not maintain single-family rent price data individually.
Property taxes: City data from Roofstock
Vacancy rates: State average vacancy per ipropertymanagement.com
Homeowners insurance: Because insurance is inaccurate using a percentage of the home price, and for simplicity, we used $100/mo for properties under $500k and $150/mo for properties over $500k.
Other costs of owning property: There was no accurate way to add in extra costs like personal income taxes, average maintenance and cap-ex, extra personal insurance or LLC creation needed, and other costs of owning rental property. Our cash flow numbers are just a starting point to pinpoint the best areas to invest using a standard methodology for all cities. The rest of the equation is up to you.
Our advise is based on experience in the mortgage industry and we are dedicated to helping you achieve your goal of owning a home. We may receive compensation from partner banks when you view mortgage rates listed on our website.

